Architecture of AI Assistant
This document outlines the process flow for using the AI feature within smartlife BI to generate visualizations from user queries via natural language processing (NLP).
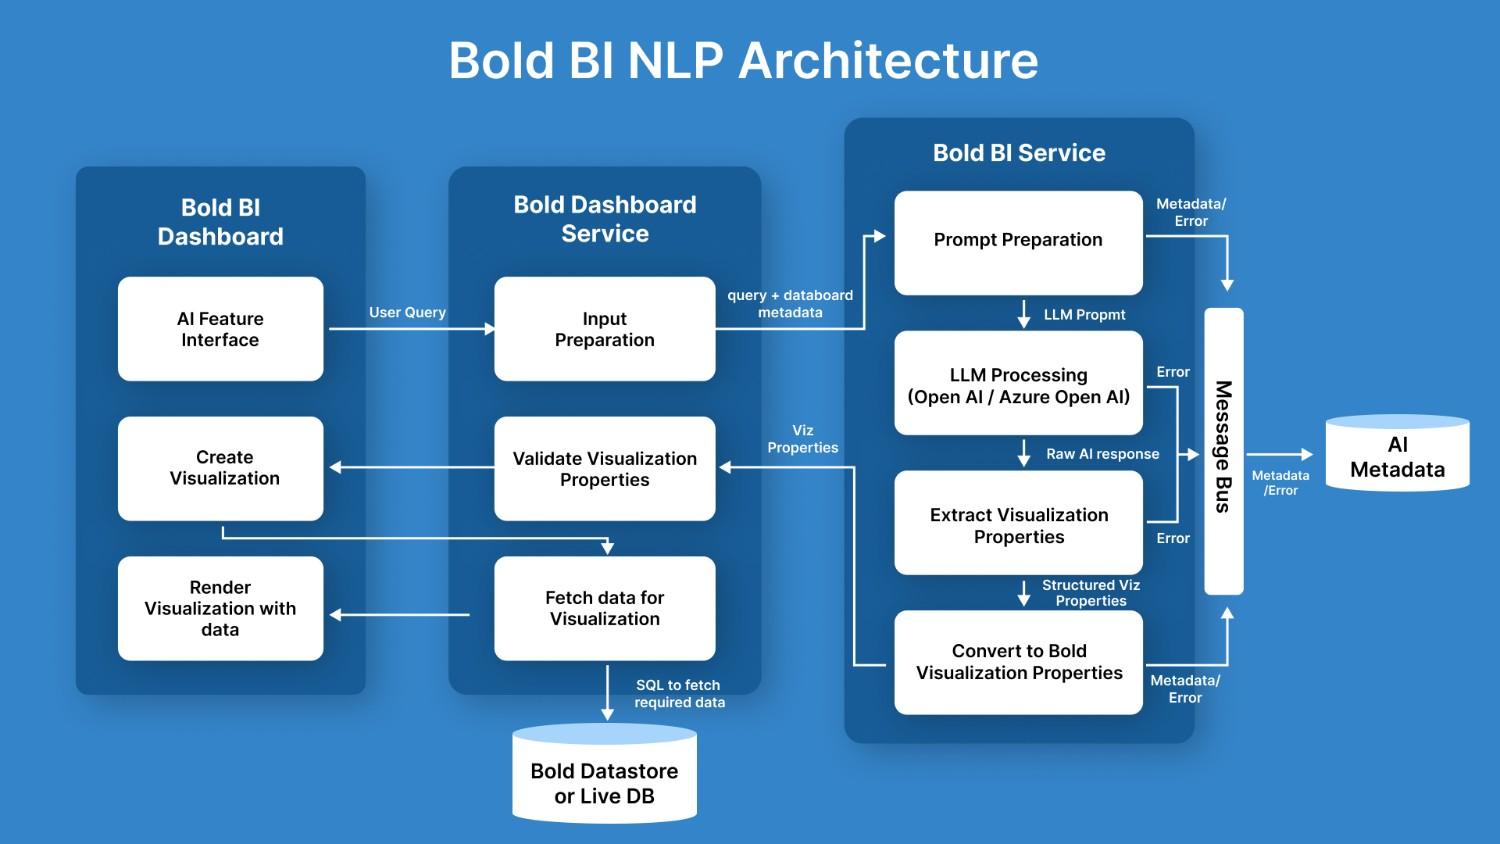
1. AI Feature Interface
- Users can interact with the AI feature interface to submit natural language queries.
- This interface allows users to request visualizations by describing their requirements in a simple query format.
2. Input Preparation
- Once a query is submitted, it is sent to the Bold Dashboard Service.
- The service prepares the input by combining the user’s query with the metadata.
3. Prompt Creation
- The prepared input (user query + dashboard metadata) is then passed to the Bold AI Service for prompt creation.
- A prompt is formulated to contact large language models (LLMs) such as OpenAI or Azure OpenAI, requesting AI-generated insights based on the user’s input.
4. LLM Processing
- The created prompt is processed by the selected LLM, which generates a raw AI response.
- This response contains potential data for visualization or appropriate response for the user’s query.
5. Extracting Visualization Properties
- The raw AI response is then analyzed to extract visualization properties, which include information about the type of chart and fields to build the visualization.
6. Converting to smartlife BI Visualization Properties
- The extracted visualization properties are converted into a format that is compatible with smartlife BI.
7. Validation of Visualization Properties
- The converted visualization properties are validated to ensure they align with the data structure and user preferences.
8. Data Fetching
- Once the visualization properties are validated, the required data is fetched from the Bold Datastore or a Live Database.
- An SQL query is generated to retrieve the relevant data for the requested visualization.
9. Creating and Rendering Visualizations
- The visualization is created based on the retrieved data and the validated properties.
- Finally, the smartlife BI Dashboard renders the visualization, which the user can interact with or further customize its properties.
Data Processing
In order to provide accurate responses, the AI Assistant sends the following information to the LLMs. This information includes:
- Query: The user’s input, which forms the basis of the AI’s response.
- Table Names: Identifies the tables involved in the dashboard, giving context to the AI model about the dataset.
- Column Names: Specifies the columns in those tables, allowing the AI to understand which fields are being referenced.
- Field Type: Indicates whether the data is a measure or a dimension, helping the AI interpret the relationships between data points.
- Data Type: Describes the data format (e.g., string, integer), enabling the AI to process the information correctly.
NOTE: No actual data from the tables is sent to the LLMs—only the table schema (table and column names, field types, and data types) is shared to ensure data security.
By combining the user’s query with the structure of the data (table schema), the AI Assistant can provide more precise and contextually relevant responses.
To ensure continuous improvement and technical accuracy, we securely store the following information for 90 days which includes:
- Query: The user’s input that initiates the AI response.
- Table Schema: The structure of the tables used in the visualization, helping us understand the context of the query.
- AI Response: The raw response generated by the AI model.
This data, along with any user feedback, is stored solely for the purpose of enhancing the quality of the AI Assistant and identifying potential technical errors.
NOTE: After 90 days, all stored data is automatically deleted, ensuring compliance with data retention policies and user privacy.